Financial information
Annual report and financial statements for the last six years.
Financial report and key financial statistics for 2024/25
The higher education sector has experienced persistent financial and operational challenges over recent years. Many universities are reporting ongoing deficits, with projections indicating that over half will incur deficits in 2024-25 and further shortfalls anticipated in subsequent years. While the government acknowledges the unsustainable nature of this trend, there is limited appetite for intervention beyond existing measures. The sector's headlines have reflected these difficulties, emphasising the need for strategic adaptation.
In 2024-25, the University has delivered a surplus of £21.6m (2024 £7.3m) this has resulted from one-off accounting adjustments, including pension revaluations and higher-than-expected interest income, as well as early realisation of savings from the University Transformation Programme. Additionally, improvements in student retention and productivity have contributed to this positive outcome. These savings, initially planned for future years, materialised earlier than expected, thereby enhancing this year's financial position but reducing the buffer for subsequent periods.
Ongoing financial pressures – such as stagnant domestic tuition fees, rising operational costs, and volatile student recruitment – continue to pose significant challenges. The surplus provides essential support for meeting obligations and funding future initiatives; however, it does not eliminate the necessity for continued fiscal discipline and strategic planning.
You can view the full annual report and financial statement as a PDF. For information about how to alter your view of the document see Adjusting PDF views.
What we spent our money on during 2024/25
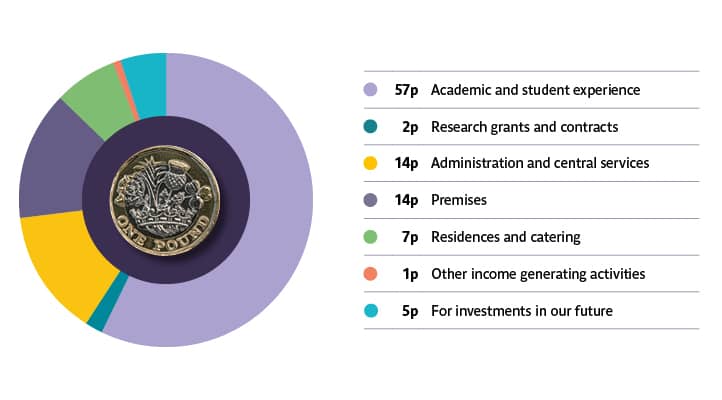
The following pie chart highlights the University's financial expenditure per pound of income for the year. You can also view in text format.

Income by type 2024/25 (£m)
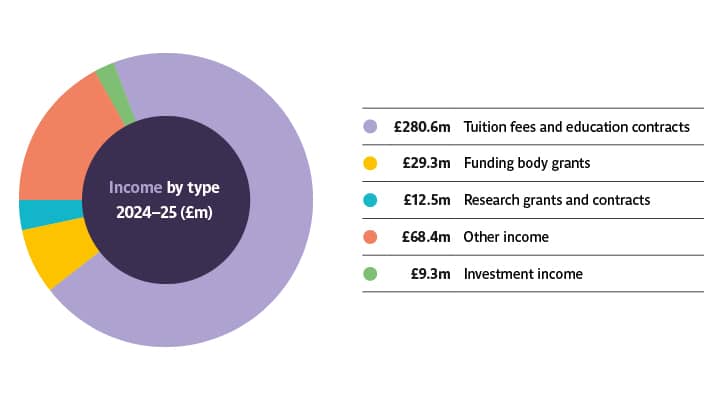
Total income for 2024/25 was £400.1m. The following pie chart indicates the University's income by type during 2024/25 (see income by type in text format).

Expenditure by type 2024/25 (£m)
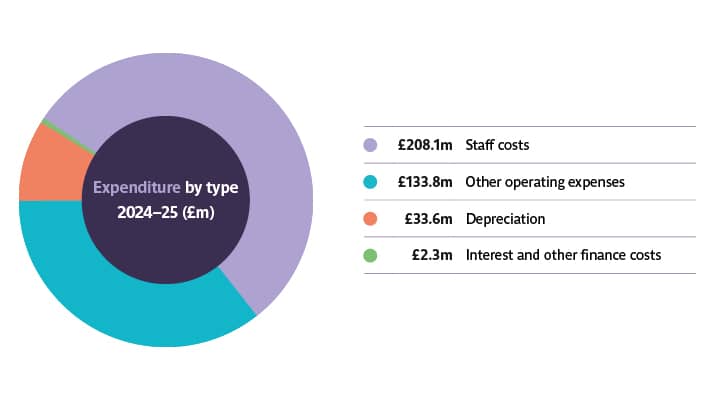
Total expenditure for 2024/25 was £377.8m. The following pie chart indicates the University's expenditure by type during 2024/25 (see expenditure by type in text format).

Income and expenditure overview (text format)
What we spent our money on during 2024/25
- Academic and student experience – 57p in the pound
- Research grants and contacts – 2p in the pound
- Administration and central services – 14p in the pound
- Premises – 14p in the pound
- Residencies and catering – 7p in the pound
- Other income generating activities – 1p in the pound
- For investments in our future – 5p in the pound
Income by type 2024/25
- Tuition fees and education contracts – £280.6m
- Funding body grants – £29.3m
- Research grants and contracts – £12.5m
- Other income – £68.4m
- Investment income – £9.3m
Expenditure by type 2024/25
- Staff costs – £208.1m
- Other operating expenses – £133.8m
- Depreciation – £33.6m
- Interest and other finance costs – £2.3m
Financial reports and statements for previous years
- Report and Financial Statements year ended 31 July 2024 (PDF)
- Report and Financial Statements year ended 31 July 2023 (PDF)
- Report and Financial Statements year ended 31 July 2022 (PDF)
- Report and Financial Statements year ended 31 July 2021 (PDF)
- Report and Financial Statements year ended 31 July 2020 (PDF)
- Report and Financial Statements year ended 31 July 2019 (PDF)
- Report and Financial Statements year ended 31 July 2018 (PDF)
You may also be interested in

About us
Information about our structure and strategy, departments, working at the University and how to find us.

Demographic data
Facts and figures about UWE Bristol, including student and staff numbers and demographic data.

Our values, vision and strategy
Our core purpose, ambition, strengths and values, including details about our Strategy 2030.
